Hyundai

ANALYTICS

hyundai

exhibition stand reporting

and methodology

CHallenge

At the Caravan, Camping and Motorhome Show at the NEC, Hyundai’s stand saw a seismic shift in design ambitions, introducing the all-new Hyundai Kona SUV. Hyundai wanted to understand the impact that design had in driving footfall to their stand to justify spend.

implementation

Meshh sensors were deployed to inform Hyundai of their conversion rates, visitor numbers, peak engagement hours and dwell time on the stand.

INSIGHTS & ACTIONS

52% of engaged visitors spent more than 15 minutes at the stand, whilst attracting a high dwell time overall of 25 minutes. Between 10:00 and 12:00 were the busiest hours across the event.

World Rallycross

ANALYTICS

world rally cross

rights holder event &

partnership measurement 

CHallenge

Meshh were approached to provide insights and analyse visitor behaviour in and around the 2018 WRX race at Circuit of the Americas in Austin Texas, USA.

implementation

Analytics sensors were installed across the entire event, covering the major activations, sponsor experiences, key spectator areas, the main stage, F&B and merchandise locations.

INSIGHTS & ACTIONS

Meshh delivered comprehensive insight into the movement of visitors around the circuit, highlighting:
 
  • peak arrival & departure times
  • how long visitors stayed at the event
  • how different activations and sponsors performed 
  • how behaviour differed across the circuit 

Leisure Attractions

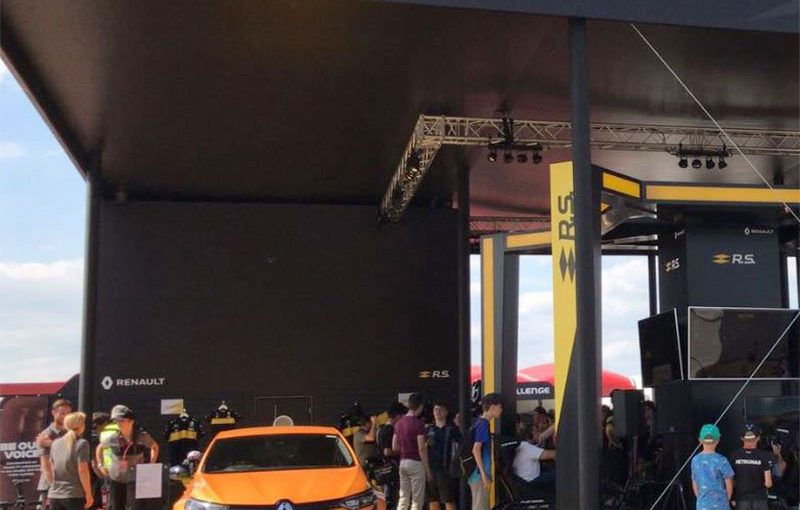
We help theme parks, cinemas, museums, theatres and other attractions understand how their visitors behave on site.

Access to information on footfall, journey patterns, repeat visits and high dwell areas allows venue owners and managers to:

  • Measure engagement with venue owned assets – how can the positioning of food and beverage stands, merchandise, and other key attractions be improved to the benefit of the customer experience and revenues?
  • Assess the impact and effectiveness of signage around the venue – are people able to get from place to place without hassle or delay?
  • Understand which days, times, areas and attractions are most popular – how does this information align with data on repeat visitors?

Want to know more about what Meshh can do to support your leisure attraction? Get in touch

OOH

We provide a clear view of how much attention out-of-home media sites are getting – and what impact they can have as a result.

With anonymised data on foot traffic around specific sites, you can:

  • Map journey patterns across local OOH networks – can you tell a bigger story with your campaign?
  • Understand the effectiveness of ads at driving footfall – how many people visit a store having seen it advertised out of home?
  • Judge the value of different media spaces more effectively – how will this inform pricing strategies?

Want to know more about what Meshh can do to enhance your OOH experience? Get in touch

Transport

We enable transport hubs and operators to measure crowd and passenger movement throughout the day.

By better understanding how, when and where people traverse the concourses, it’s possible to:

  • Identify footfall pinch points and how passengers flow around a station or airport at different times of day – what does this look like at rush hour? How will the space cope with that?
  • Evaluate and build proof points for new billboards, media sites, retail spaces and experiential areas – which locations provide the best value and engagement?
  • Learn how environmental factors such as delays and weather affect consumer behaviour – does a long wait mean more time spent in a station’s retail outlets?

Want to know more about what Meshh can do to maximise your travel experience? Get in touch

Public Spaces / Commercial Property

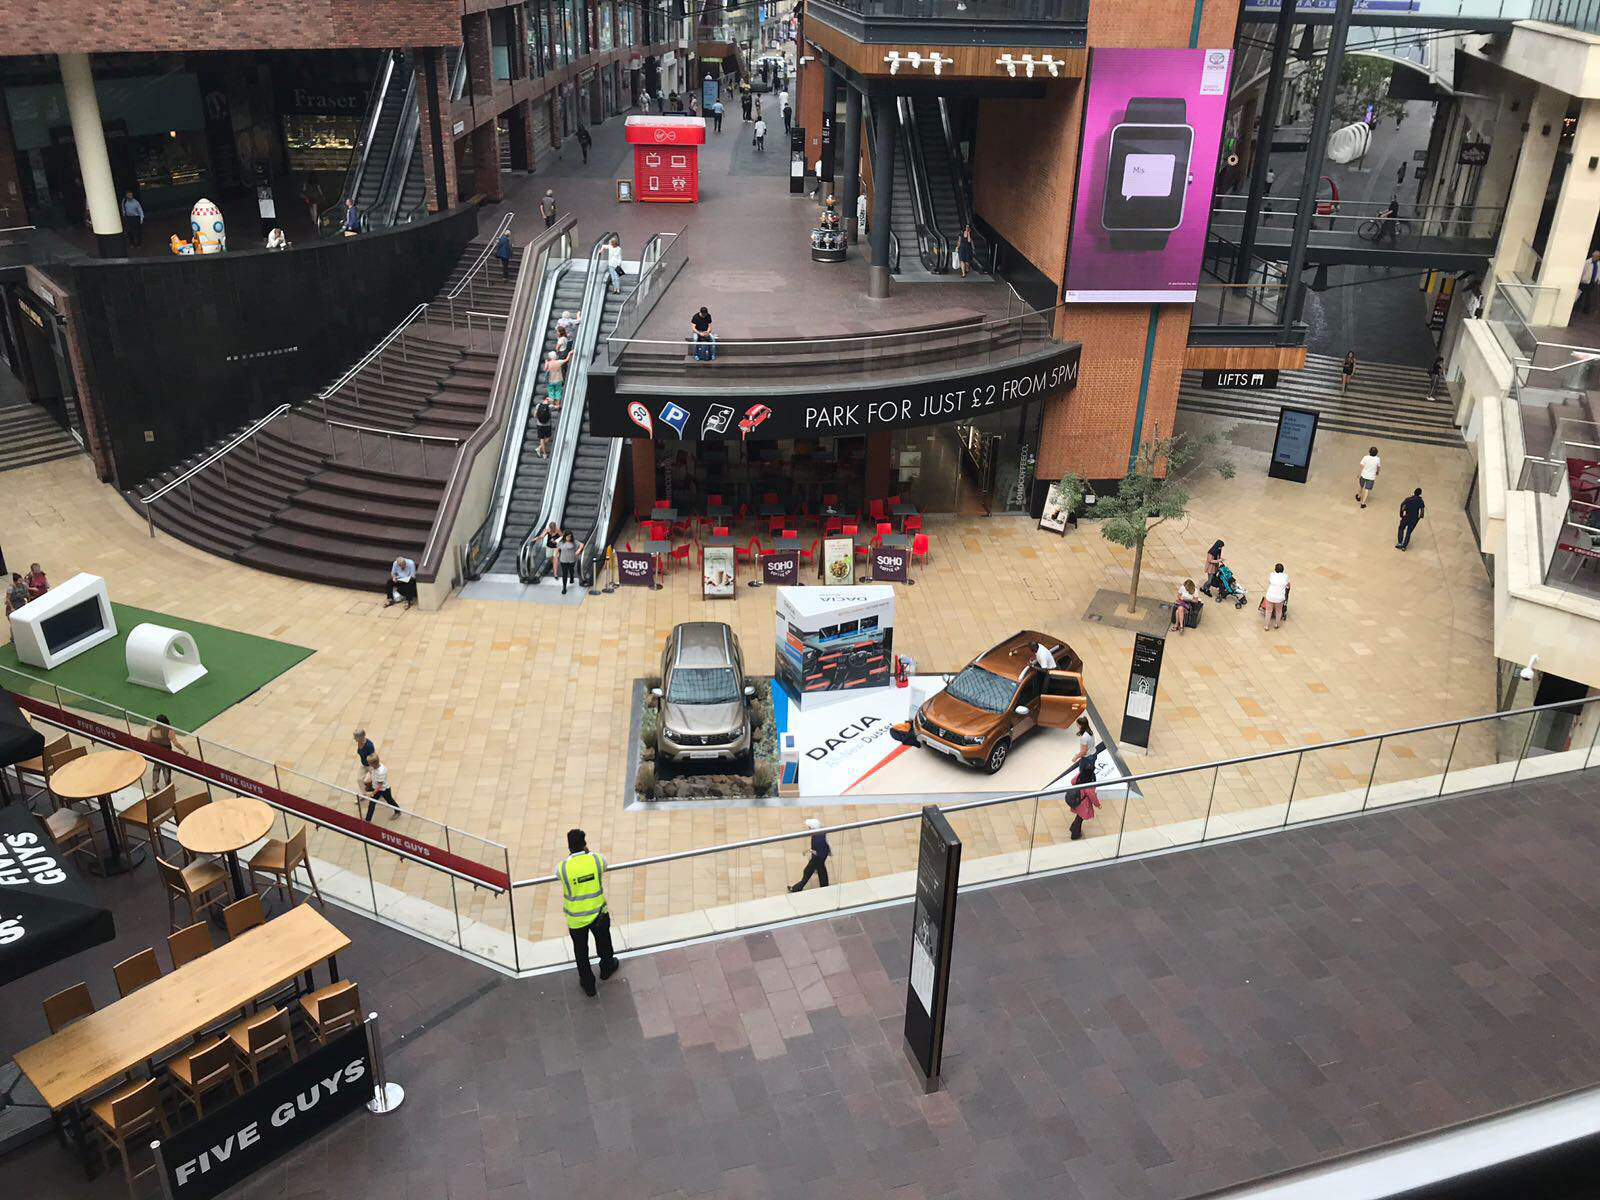
We provide data on public places and commercial properties to help managers and leaseholders better understand how people engage and interact with their spaces.

Our technology delivers information on footfall, engagement and dwell time, helping you:

  • Understand how results differ by time and day – how do evenings at the weekend compare with those throughout the week?
  • Identify bottlenecks and pinch points, popular locations, and consumer journey paths – how is layout affecting the way people use the area and how can this understanding help you optimise your space?
  • Understand how environmental factors affect visitor behaviour – do rainy days keep people away, or is your property an ideal place to shelter?
  • Support pre- and post-investment analysis for key stakeholders and local communities – can measuring repeat visits help to demonstrate long-term value?

Want to know more about what Meshh can do for your space? Get in touch

F1 Live

ANALYTICS

f1 live

fan experience &

commercial excellence

CHallenge

In a bid to expose new audiences to the race day experience, F1 run F1 Live events in cities near the main Grands Prix. 
 
Meshh were tasked with measuring the success of the events in Marseilles, Milan and Miami to track whether they'd hit their KPIs.

implementation

15 sensors were deployed at each city centre based event, to measure fan engagement with F1 & partner activations, a main stage showing track activity across the race weekend, merchandise stands and F&B.

INSIGHTS & ACTIONS

F1 gained insight into total visitors at each event, dwell time on site, visit frequency, peak times for merchandise, most popular zones within the event and number of people also seen at the main F1 event in each respective country. 

Engagement data was also provided to partners including Heineken and Red Bull, to prove the value of activating at F1 events. 

Google Pixel

ANALYTICS

google pixel

CHallenge

As the largest hip hop festival in the world, Rolling Loud was an ideal spot for Google to promote their Pixel range of devices to a young, tech-savvy audience. 
 
Meshh were brought on board by Live Nation to help Google better understand how festival goers engaged with their activation. 

implementation

Meshh used three sensors to capture behaviour at two branded assets placed around the event grounds – enabling Live Nation to understand how the time of day and activities, such as artist appearances and the event's performance schedule, impacted engagement and dwell time at the activations.

INSIGHTS & ACTIONS

Live Nation was able to provide performance analysis data on the partnership, helping Google's activation team to understand the conversion of passerby traffic as well as the impact of scheduling on the flow of traffic at the experiential assets.

Dacia

 ANALYTICS

DACIA

challenge

With a summer tour of leading UK shopping centres including Westfield and Trafford Centre, Dacia’s Activation team were keen to measure visitor engagement with the stand across each location.

implementation

A single Meshh sensor was placed on a central totem on their stand, enabling Dacia to measure brand exposure, engagement, dwell time, frequency of visit and total opportunities to see.

INSIGHTS & ACTIONS

Being able to review the performance of each location helps Dacia to more accurately review future activations and placement within each venue. 

And with a comprehensive breakdown to support their ROI analysis, Meshh also enables Dacia to objectively compare their experiential spend against other marketing channels.

Renault

 ANALYTICS

renault

challenge

Silverstone Grand Prix is the perfect opportunity to connect with motorsport fans and prospective car buyers alike. 

Renault therefore activated for 4 days in the fan zone to capitalise – giving fans the opportunity to enjoy e-sports games, a reaction wall, two F1 heritage cars and two current models in their range.

Yet how to determine the success of the branded experience? 

implementation

The Renault activation was tagged with 3 sensors to help them understand how effective they were at attracting footfall as well as which zone held the most appeal.

This also gave them the opportunity to measure the impact on footfall of broader environmental factors such as practice, qualifying, the F1 and F2 races and the hotly anticipated England v Sweden World Cup quarter final.

INSIGHTS & ACTIONS

Unsurprisingly there was a drop off in footfall during the F1 race and England’s progression into the semi-finals of the World Cup, however the activation held strong appeal beyond that, with Saturday proving the most popular day.

With an average dwell time of just under 11 minutes across the 4 days, it’s clear that fans considered the stand a worthy place to spend their time.